Tableau is a visual analytics engine that makes it easier to create interactive visual analytics in the form of dashboards. These dashboards make it easier for non-technical analysts and end users to convert data into understandable, interactive graphics.
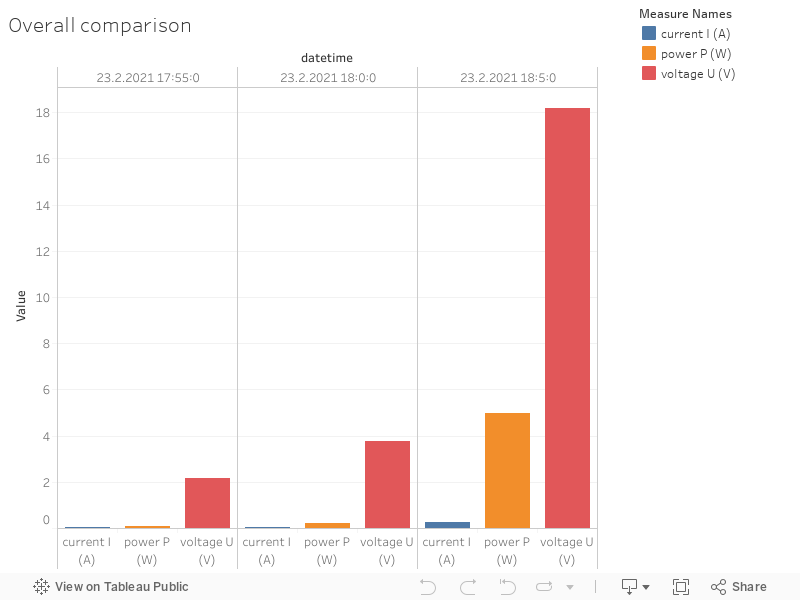
Using the data take off of excel, Tableau allows you to visually represent the data in a clear way. It shows people with little knowledge about your project an easier understanding of the data taken and what it means. Below are are examples of data taken from a 15 minute period. on the left is the overall comparison of each bar chart and on the right is an overall comparison of the chart
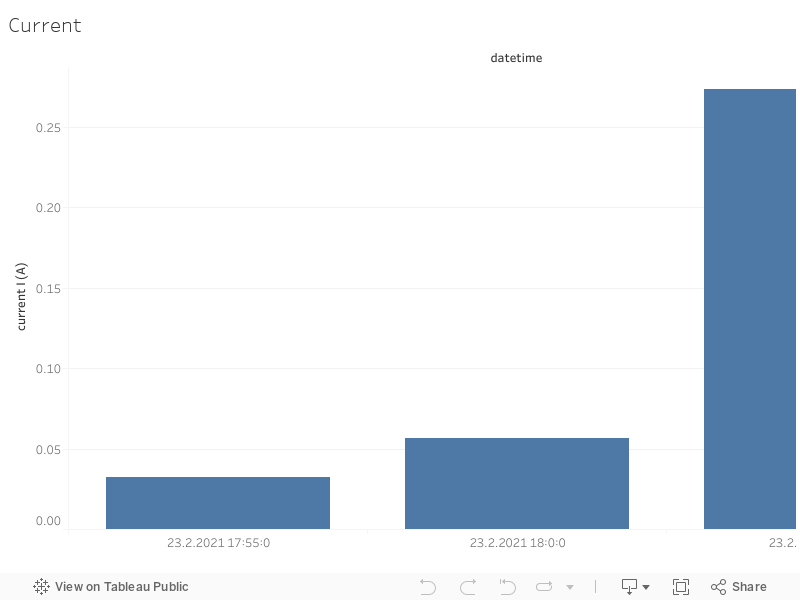
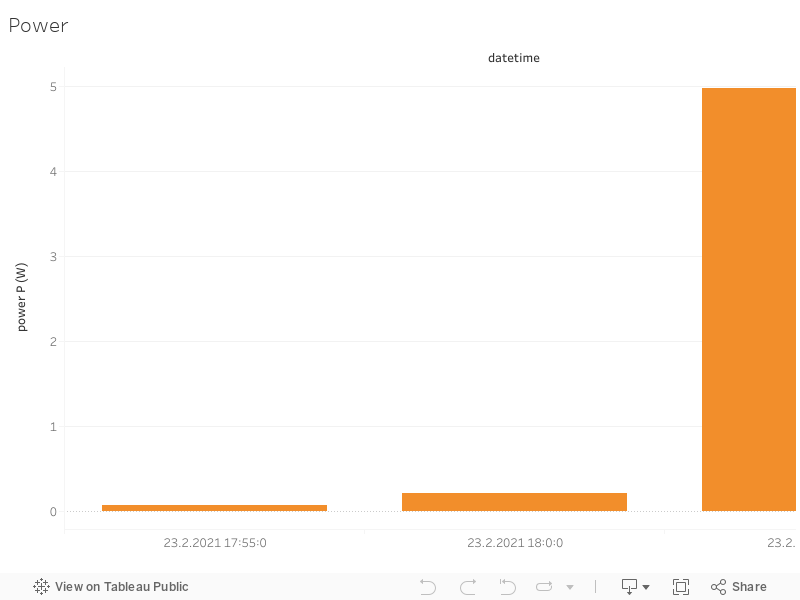
Data was taken 5 minutes apart in the evening, this chart shows there can be a huge difference in the current, power and voltage being generated.
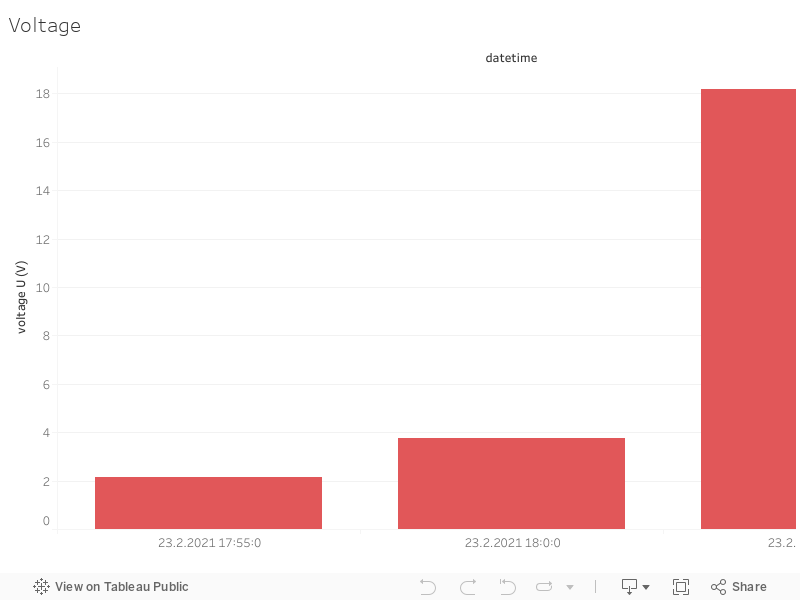
On the first chart there is 2.14V being generated and then just 10 minutes later there is 18.2V being generated.
This is most likely a cloud covering the sun then moving away which can make such a huge difference